- An increase of 0.83% has been observed in the RNDR crypto price during the intraday trading session.
- The all-time high price of the cryptocurrency is at the $13.60 mark.
- 24-hour trading volume has reached $168.35 million, with an increase of 17.48%.
Render (RNDR) is a distributed graphics processing unit (GPU) rendering network on the Ethereum blockchain. With the help of mining partners willing to rent their GPU capabilities, the network aims to connect artists and studios needing GPU computing power. RNDR is an ERC-20 utility token to exchange GPU compute power from the node operators. Render combines automatic proof of work and proof of render consensus mechanism.
Render Crypto Gave 86.11% as Year to-date Returns
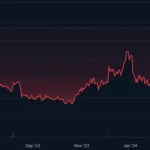
A massive rise in RNDR price was witnessed on March 6, 2024, from the $6.52 bullish point of interest (POI). The cryptocurrency reflected an over 100% bullish rally to the $12.73 resistance level within one month. Afterward, the price gave another impulsive bullish move from the $10.01 POI on March 17, 2024.
The impulsive move resulted in a 36% bullish rally and a new all-time price of $13.60. Since then, the Render price has been experiencing a bullish correction, lasting longer than expected. On the other side, the buyers are facing constant troubles after the breakdown of the $10.01 support.
RNDR has a maximum supply of 536.87 million tokens, of which 381.86 are in current circulation, 71.13% of the maximum supply. The total diluted valuation of the project is assumed to be at $5.01 billion. The current market capitalization of Render Crypto stands at $3,56 billion with a 4.62% volume-to-market capitalization (VMR) ratio.
Price to Volume and Social Dominance Analysis
The social buzz of the cryptocurrency spiked after February 19, 2024, covering almost 0.72% of the crypto world. That hike also positively impacted the rise of the price and trading volume of RNDR crypto. However, the social dominance has been fading since mid-March 2024. On the other side, the volume reflects stability above $150 million.
Technical Analysis of the Render (RNDR) Price
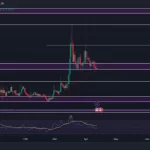
The short-term outlook lies below the critical exponential moving averages on the bearish side. The 50-day and the 200-day EMAs had a death crossover at $9.63, reflecting a negative sentiment in the price. The 50-day EMA can act as a dynamic resistance.
RNDR crypto price has given a breakdown of the $9.46 support level. Afterward, the price fell on the $8.70 mark and made a bearish retracement on the $10.01 POI. The price faced selling from that level and is moving at $9.09. The price will continue moving down unless the price advances above the $10.16 Resistance.
Track all markets on TradingView
{
“width”: “750”,
“height”: “400”,
“symbol”: “COINBASE:RNDRUSD”,
“interval”: “240”,
“timezone”: “Etc/UTC”,
“theme”: “dark”,
“style”: “1”,
“locale”: “in”,
“enable_publishing”: true,
“allow_symbol_change”: true,
“details”: true,
“calendar”: false,
“studies”: [
“STD;Supertrend”
],
“support_host”: ”
}
The relative strength index (RSI) reflects an internal bullish divergence in momentum, indicating increasing buying pressure. The RSI is moving at 45.17 above the signal line.
Summary
The Render crypto price has shown a strong bullish move from the $6.52 POI on March 6, 2024. However, the cryptocurrency faces a correction period, which can last until the $8.24 level. At press time, the RNDR price is trading at $9.09. The price will continue moving down unless the price advances above the $10.16 Resistance.
Technical Levels
- Resistance Levels: $10.16 and $11.69
- Support Levels: $8.70 and $7.91
Disclaimer
The views and opinions stated by the author or any people named in this article are for informational purposes only. They do not establish financial, investment, or any other advice. Investing in or trading crypto or stock comes with a risk of monetary loss.
The post <strong>Buyers Face Constant Declines; Render Price Fell 19%</strong> appeared first on The Market Periodical.

