- The AKT crypto price has advanced by 43% in just two days at press time.
- Akash Network has outperformed the Bitcoin and Ethereum prices in the last 1 year.
Akash Network, a decentralized cloud platform, utilizes $AKT as its native token, which has roles in staking, governance, payment for computing resources, security via Proof-of-Stake, and incentivization.
Founded by CEO Greg Osuri, it offers an alternative to conventional cloud services, fostering a peer-to-peer marketplace for resource exchange.
Over the last 24 hours, the market cap of Akash Network has advanced by 30%. The crypto’s market cap ranking is #63.
The surge in the trading price of the crypto is supported by a rise of 336% in the traded volume of the crypto. Moreover, the volume increase shows that the price surge is reliable.
It also represents the fact that new players are entering the market and joining the Akash Network rally. That resulted in a huge liquidity of 16.97%, followed by a traded volume of $295.221M over the last 24 hours.
At press time, there was 60.8% of the maximum supply of the crypto in circulation, resulting in 236.269M AKT. Also, the maximum supply of crypto was 388.539M AKT and a fully diluted market cap of $2.424B.
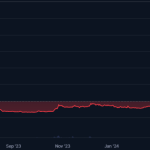
Open Interest vs. Social Dominance of Akash Network Crypto
The social dominance of Akash Network crypto has started to advance in the last few days, followed by a huge surge in the trading price.
The social volume of crypto is also advancing, indicating a rise in the number of active users in the crypto community.
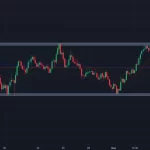
AKT Crypto Showing Strong Buying Confluence On Technical Chart

The AKT crypto formed a symmetric triangle pattern, and the strong dominance of bulls led to a powerful breakout in the crypto trading price.
A strong surge follows the breakout in crypto price and trading volume. It shows a higher possibility of prices advancing to higher levels in the upcoming days.
var tradingview_embed_options = {};
tradingview_embed_options.width=”750″;
tradingview_embed_options.height=”400″;
tradingview_embed_options.chart=”EtyZ49hs”;
new TradingView.chart(tradingview_embed_options);
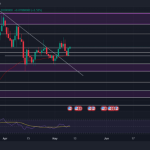
AKT/USD Chart by TradingView
The price of the AKT crypto has broken above the crucial EMAs plotted on the crypto daily chart.
Trading in a golden cross, the EMAs of 50-day and 200-day EMAs have consistently advanced in value over time.
The MACD indicator also gives a strong buy signal, followed by the MACD and the signal line trading in a bullish cross. Bullish sentiment is supported by the MACD histogram, as indicated by the chart’s histograms.
The RSI has also advanced to the level of 67.9 from the crypto oversold zone. The RSI has advanced above the 14-day SMA and is approaching the overbought zone.
Summary
Akash Network’s AKT crypto price surged 43% in two days, outperforming Bitcoin and Ethereum.
With a 30% market cap increase and a 336% surge in trading volume, new players enter the market.
Social dominance and volume rise, while a breakout from a triangle pattern signals strong bullish momentum supported by technical indicators.
The support levels for the AKT crypto are $2.330 and $2.990, but as the price of the crypto advances, it might face resistance at $6.480 and $7.50.
Disclaimer
This article is for informational purposes only and does not provide any financial, investment, or other advice. The author or any people mentioned in this article are not responsible for any financial loss that may occur from investing in or trading. Please do your research before making any financial decisions.
The post <strong>Strong Breakout Above Pattern: Best Time To Invest In AKT?</strong> appeared first on The Market Periodical.
