- Zilliqa’s weekly price has decreased by 20%, which shows weakness.
- ZIL price is trading below the key moving averages, showcasing a bearish forecast.
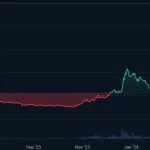
ZIL price has been experiencing selling momentum for the last few weeks as the current crypto market sentiment is mildly bearish. Since February, the price has been bullish and received a buying momentum of 100%. It reached a 52-week high of $0.0449 on March 13, 2024.
According to the technical chart, the price is bearish, and sellers have dragged it below the 200-day exponential moving average. The asset price has dropped to the major support level of $0.0220, and sellers face difficulty breaching it.
At press time, the Zilliqa crypto price traded at $0.0225 with an intraday loss of 1.14%. The market capitalization is $391.25 million, and the 24-hour trading volume is $23.97 million, with a gain of 29%.
The circulating supply is 17,372,203,179 ZIL, and the fully diluted market cap is $472.52 million. The total supply is 19,073,304,227 ZIL, and the maximum is 21,000,000,000 ZIL.
Will ZIL Price at the Major Support Level Defend the $0.0220 Level?
Zilliqa price has witnessed selling pressure and has lost approximately 40% in a month. In mid-March, the price melted to the major support level of $0.0220 and bounced back.
However, the trading volume did not support the buying momentum and dropped to the significant support level of $0.0220.
Track all markets on TradingView
{
“width”: “750”,
“height”: “400”,
“symbol”: “BINANCE:ZILUSD”,
“interval”: “D”,
“timezone”: “Etc/UTC”,
“theme”: “dark”,
“style”: “1”,
“locale”: “in”,
“enable_publishing”: true,
“allow_symbol_change”: true,
“calendar”: false,
“studies”: [
“STD;MACD”
],
“support_host”: ”
}
New buyers can be attracted if the asset price defends the major support level and exceeds the 200-day exponential moving average. If the trading volume increases and the chart structure attracts investors, the price may form a higher low and gain bullish momentum.
On the contrary, if the price starts trading below the $0.0220 mark, it may sign a negative forecast. If it sustains below the major support level, sellers may become confident. They can drag the price to $0.0150 in the next few weeks or months.
Technical Analysis of ZIL Price Over 4-H Timeframe
On a 4-H time frame, the chart structure showed weakness and fell by facing resistance from the key moving averages. The price has melted to the last swing low and was recovering with a strong positive candlestick at the time of writing.
If the buyers accumulate and trading volume increases, the Zilliqa crypto price may extend to the major level of $0.0280 in a few days. Suppose the price reaches the $0.0280 mark and forms any bearish candlestick pattern; it may witness bearish momentum and approach the last swing high.
Development Activity and Active Social Users Analysis For Zilliqa Crypto
According to the data, the development activity and active social users have remained constant for the last few weeks.
Regarding accurate data, the development activity has decreased slightly, impacting the price negatively. The price may gain bullish momentum if the development activity and active social users increase.
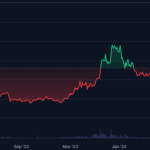
Zilliqa Crypto Volume vs Price Analysis
The graph shows that the trading volume has dropped from $410 million to $27 million, which has led to negative momentum in the price.
In the last 2 days, the trading volume has increased by more than 100%, but the price has reacted negatively. According to the trading volume, the cryptocurrency price may gain bullish momentum in the next few days.
Conclusion
Zilliqa’s price is currently bearish and has lost 42% in April. The asset price trades below the key moving averages, a bearish forecast.
The crypto market sentiment is mildly bearish, and sellers have dragged the price below the 200-day exponential moving average. At press time, ZIL was trading at $0.0225 with an intraday loss of 1.14%.
New buyers can be attracted if the asset price defends the primary support level of $0.0220 and exceeds the 200-day exponential moving average. On the other hand, if the price starts trading below the $0.0220 mark, it may signify a negative forecast.
Technical Levels
Resistance: $0.0280 & $0.0350
Support: $0.0195 & $0.0160
Disclaimer
This article is for informational purposes only and provides no financial, investment, or other advice. The author or any people mentioned in this article are not responsible for any financial loss that may occur from investing in or trading. Please do your research before making any financial decisions.
The post <strong>ZIL Crypto Price Has Lost 42% in April; Will Buyers Bounce Back?</strong> appeared first on The Market Periodical.

